
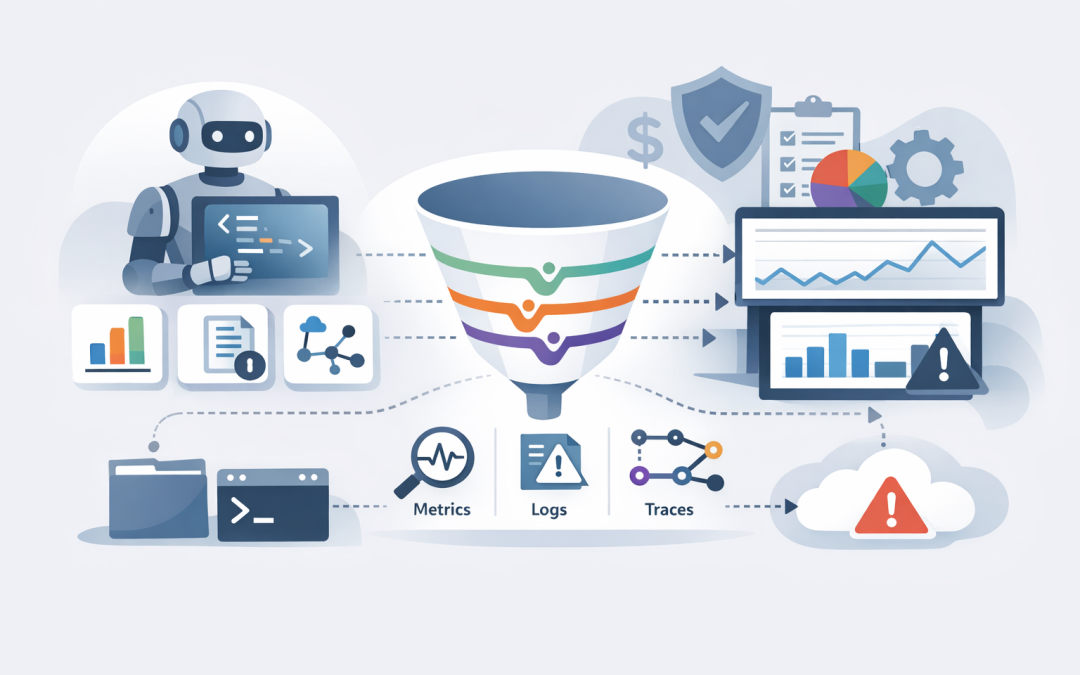
In this blog post Monitoring Claude Code and Agent Activity With OpenTelemetry we will look at how business and technology leaders can keep visibility over AI coding activity before costs, security risks, or poor governance quietly get out of hand.


If your developers are already using Claude Code, or if you are planning to introduce AI agents into software delivery, the uncomfortable question is not whether the tool is powerful. It is whether you can see what it is doing.
For many mid-market organisations, AI coding tools start as a productivity experiment. A few developers use them to fix bugs, write tests, update scripts, or modernise old code. Then usage spreads quickly, the monthly bill rises, and nobody can clearly answer which teams are using it, what it is changing, how much it costs, or whether risky actions are being approved properly.
That is where OpenTelemetry comes in.
What OpenTelemetry means in plain English
OpenTelemetry, often shortened to OTel, is an open standard for collecting operational data from software. In simpler terms, it is a common language for sending useful monitoring information from one system to another.
Instead of each tool having its own reporting format, OpenTelemetry lets Claude Code and agent workflows send data to the monitoring platforms your IT team may already use, such as Grafana, Datadog, Honeycomb, Langfuse, SigNoz, Microsoft-aligned observability tooling, or a self-managed OpenTelemetry Collector.
For Claude Code, this can include three practical types of information:
- Metrics, which are numbers over time, such as token usage, estimated cost, session count, or tool decisions.
- Logs, which are structured records of events, such as prompts, tool results, API errors, or failed actions.
- Traces, which show the journey of a request, including model calls, tool calls, delays, failures, and hand-offs.
If you are a CIO or CTO, you do not need to become an observability engineer. The important idea is this: OpenTelemetry gives you the evidence layer for AI agent activity. It helps answer, “What happened, who triggered it, what did it cost, and did it stay inside our rules?”
This builds naturally on the governance questions we covered in Designing Secure Tool Use for Claude Agents in Business Systems. Controls decide what an agent is allowed to do. Monitoring proves what it actually did.
The business problem is not lack of AI adoption
Most organisations are no longer asking whether AI can help developers. They are asking whether AI can be adopted safely, affordably, and consistently.
A 150-person business might have a small internal development team maintaining customer portals, reporting tools, automations, integrations, and legacy systems. Claude Code can help that team move faster, especially when used well. But without monitoring, leaders are left guessing.
- Which developers or teams are using Claude Code the most?
- Which projects are consuming the most tokens and cost?
- Are agents repeatedly failing and retrying expensive tasks?
- Are tools being used to edit files, run commands, or connect to business systems?
- Can the organisation produce an audit trail if something goes wrong?
These are not technical vanity metrics. They affect budgets, security, compliance, and productivity.
Why Claude Code monitoring matters for decision-makers
1. You can control AI spend before it becomes a surprise
AI coding tools can feel inexpensive at the start. The problem is that cost often grows quietly as more people use them, as context windows get larger, and as agents run longer tasks.
OpenTelemetry helps you track token usage, estimated cost, sessions, and activity by team or environment. Tokens are the pieces of text an AI model reads and writes. More tokens usually means more cost.
For a business leader, the outcome is simple: you can move from “AI spend feels high” to “these three workflows are driving 68 percent of our usage, and this one is worth optimising.”
2. You can spot productivity gains that are real, not anecdotal
Developers may say Claude Code saves time, and often they are right. But leadership still needs evidence before expanding licences, changing delivery practices, or building agent workflows into production processes.
Monitoring can show session volume, tool activity, error rates, successful completions, and time spent waiting on model responses. Combined with delivery metrics such as pull requests, incident reduction, or cycle time, this helps build a more honest view of return on investment.
This extends the adoption and ROI thinking from Why Claude Code Is Suddenly on Every CIO’s Radar in 2026. The next step after adoption is measurement.
3. You can reduce security risk from agent tool use
Claude Code becomes much more powerful when it can use tools. That might include reading files, editing code, running tests, calling internal APIs, or working with developer systems.
That power needs visibility. If an agent attempts a risky command, connects to an unexpected tool, or repeatedly fails on a sensitive task, your team should know quickly.
OpenTelemetry does not replace access control. It complements it. Think of it like CCTV for your AI development workflows: it does not stop every bad decision by itself, but it gives your team the evidence to detect, investigate, and improve controls.
4. You can support governance and compliance conversations
Australian organisations are under increasing pressure to demonstrate that systems are controlled, monitored, and recoverable. The Essential 8, the Australian government’s cybersecurity framework that many organisations are now expected to align with, is not specifically about AI coding agents. But its themes are very relevant: control access, patch systems, restrict risky actions, log activity, and recover from incidents.
If AI agents are touching code, infrastructure scripts, identity systems, or business data, leaders need an audit trail. OpenTelemetry can help provide that operational record.
For boards and executives, this changes the conversation from “trust us, the developers are using AI responsibly” to “we have controls, logs, reporting, and review processes.”
How the technology works behind the scenes
Claude Code can export telemetry using environment variables. Environment variables are simple configuration settings passed to software when it starts. They tell Claude Code whether to send monitoring data, what type of data to send, and where to send it.
A basic setup might look like this:
export CLAUDE_CODE_ENABLE_TELEMETRY=1
export OTEL_METRICS_EXPORTER=otlp
export OTEL_LOGS_EXPORTER=otlp
export OTEL_EXPORTER_OTLP_PROTOCOL=grpc
export OTEL_EXPORTER_OTLP_ENDPOINT=http://localhost:4317
export OTEL_METRIC_EXPORT_INTERVAL=10000
export OTEL_LOGS_EXPORT_INTERVAL=5000

claude
In plain English, this says:
- Turn Claude Code telemetry on.
- Send metrics and logs using OTLP, the OpenTelemetry Protocol.
- Use gRPC, a fast communication method commonly used between services.
- Send the data to a local collector on port 4317.
- Export metrics every 10 seconds and logs every 5 seconds during testing.
In production, you would usually avoid every developer manually setting this up. Administrators can centrally manage settings so telemetry is applied consistently across teams. For organisations already using Microsoft Intune, which manages and secures company devices, this can be part of a broader endpoint management approach.
The role of the OpenTelemetry Collector
The OpenTelemetry Collector is a small service that receives monitoring data, processes it, and forwards it to the right destination. Think of it as a switchboard for telemetry.
Instead of every laptop, server, or agent sending data directly to multiple systems, Claude Code can send data to the collector. The collector can then forward metrics to a dashboard, logs to a security platform, and traces to an observability tool.
A simplified collector configuration may look like this:
receivers:
 otlp:
 protocols:
 grpc:
 endpoint: 0.0.0.0:4317
 http:
 endpoint: 0.0.0.0:4318

processors:
 batch:

exporters:
 logging:
 verbosity: basic
 otlp:
 endpoint: your-observability-platform:4317
 tls:
 insecure: false

service:
 pipelines:
 metrics:
 receivers: [otlp]
 processors: [batch]
 exporters: [otlp]
 logs:
 receivers: [otlp]
 processors: [batch]
 exporters: [otlp]
This is not something most executives need to configure themselves. But it is worth understanding the pattern. Claude Code produces the evidence. OpenTelemetry carries it. The collector routes it. Your dashboards and alerts turn it into decisions.
What should you actually monitor?
The mistake many organisations make is collecting everything and reviewing nothing. A better approach is to start with a small set of questions that matter to the business.
Cost visibility
- Total Claude Code usage by day, week, and month.
- Estimated cost by team, project, model, or environment.
- High-cost sessions that may indicate inefficient prompts or runaway agent loops.
Adoption and productivity
- Active users and sessions over time.
- Tool usage patterns, such as file edits, searches, test runs, and code changes.
- Failed sessions or repeated retries that slow teams down.
Security and governance
- Use of sensitive tools or commands.
- Agent activity in production repositories or high-risk systems.
- Permission changes, failed tool attempts, and unusual access patterns.
Reliability
- API errors and timeouts.
- Slow model responses.
- Trace data showing where agent workflows break down.
This is especially important when moving from individual Claude Code use to production-grade agents, which we explored in Building Production AI Agents With Claude API and Agent SDKs.
A practical example
Consider a 220-person professional services company with a 12-person technology team. Developers are using Claude Code to maintain internal applications, automate reporting, and update integration code.
At first, management sees faster delivery. Then the finance team notices AI costs increasing each month. The CTO also worries that agents may be interacting with scripts connected to client data.
By adding OpenTelemetry monitoring, the company can see that most cost is coming from two long-running workflows. One is genuinely valuable because it reduces manual testing effort. The other is repeatedly retrying because the agent lacks the right project context.
The result is practical, not theoretical. The team improves the prompt and repository instructions, reduces wasted usage, creates alerts for unusually long sessions, and limits sensitive tool access. Spend drops, delivery stays fast, and the CTO has a defensible governance story.
How CloudProInc approaches this with clients
At CloudProInc, we usually recommend starting small. Do not build a giant AI monitoring program before you understand how teams are actually using the tools.
A sensible first phase looks like this:
- Define the business questions. What do you need to know about cost, risk, productivity, and compliance?
- Enable telemetry for a pilot group. Start with one development team or one agent workflow.
- Route data to a trusted platform. Use an OpenTelemetry Collector and connect it to your preferred monitoring or security tools.
- Create simple dashboards. Focus on spend, usage, errors, tool activity, and high-risk events.
- Set alert thresholds. Flag unusual cost spikes, repeated failures, or risky tool behaviour.
- Review monthly. Use the data to improve policies, prompts, access controls, and training.
Because CloudProInc works across Microsoft 365, Azure, Intune, Defender, Wiz, OpenAI, and Claude, we tend to look at AI monitoring as part of the wider security and operations picture. Claude Code telemetry should not sit in a separate reporting island. It should connect to how your business already manages devices, identities, cloud platforms, and security events.
The key takeaway
Claude Code and AI agents can help teams move faster, but speed without visibility creates new problems. Costs become hard to explain. Security teams lose confidence. Leaders struggle to prove whether AI investment is paying off.
OpenTelemetry gives you a practical way to monitor what matters: usage, cost, tool activity, failures, and agent behaviour. It turns AI adoption from a hopeful experiment into something measurable and manageable.
If you are using Claude Code, building Claude agents, or considering AI-assisted development in your organisation, now is the time to put the monitoring layer in place. It is much easier to design visibility early than to reconstruct what happened after an incident or budget surprise.
If you are not sure whether your current AI setup gives you enough visibility, CloudProInc can help you assess it. We are a Melbourne-based Microsoft Partner and Wiz Security Integrator with 20+ years of enterprise IT experience, and we are happy to take a practical look at your environment — no pressure, no jargon, just clear advice.
Discover more from CPI Consulting
Subscribe to get the latest posts sent to your email.