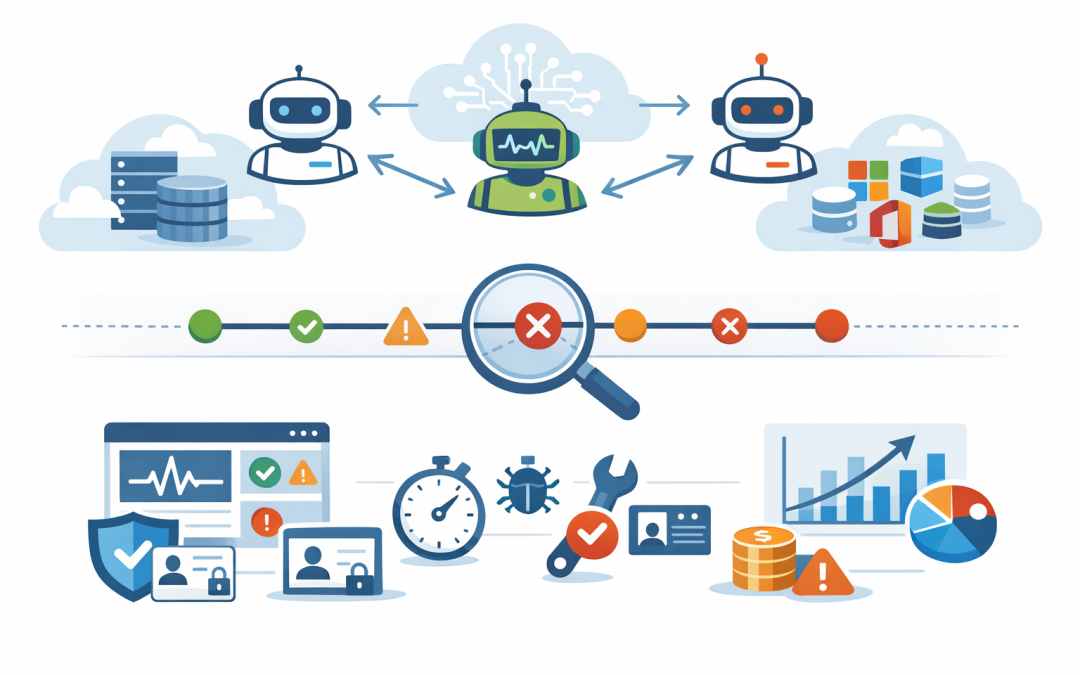
In this blog post Monitoring and Troubleshooting A2A Agent Communication in Azure we will explain how to see what happens when AI agents exchange work, identify where failures occur and prevent small issues from becoming expensive business disruptions.

The challenge is that an agent workflow can appear simple to an employee while involving several systems behind the scenes. One agent may interpret a request, another may retrieve customer information, a third may prepare a document and a fourth may seek approval. If the final result is late or wrong, a standard application error log rarely tells you which step caused the problem.
What A2A agent communication actually means
Agent-to-Agent, or A2A, is an open communication standard that allows independent AI agents to discover capabilities, exchange messages and manage work together. The agents can use different programming languages, AI models or hosting platforms while still communicating through a common set of rules.
In Azure, an A2A agent may run in Azure Container Apps, connect to Microsoft Foundry Agent Service, call Azure OpenAI or another model, and access business systems such as Microsoft 365, Dynamics 365 or a custom application. Our related guide on building A2A agents with ASP.NET Core and Azure Container Apps explains how that foundation fits together.
Monitoring provides the operational view across this chain. Instead of merely knowing that “the AI failed”, your team can see which agent received the request, what service it called, how long each step took and where the process stopped.
Why normal application monitoring is not enough
A traditional business application usually follows a predictable path. A multi-agent workflow can choose different agents, tools and processing steps depending on the request.
A task that normally uses two agents might suddenly use six because the original request was unclear. That can increase response time, model usage and cloud costs without generating an obvious technical failure.
Tech leaders therefore need visibility across three levels:
- Service health: Are the agents online, responsive and able to reach their dependencies?
- Conversation flow: Which agents handled the task, and in what order?
- Business result: Did the workflow complete accurately, within the expected time and at an acceptable cost?
Build one trace across the complete conversation
The most important monitoring control is distributed tracing. A trace is a timeline that follows one request as it moves between agents and services.
Azure Monitor Application Insights can collect this information using OpenTelemetry, an industry-standard way of producing application traces, logs and performance measurements. Azure Container Apps can also route OpenTelemetry data to Application Insights or another compatible monitoring destination.
Every agent should pass the same trace context to the next agent. It should also record useful identifiers such as the task ID, calling agent, receiving agent, operation name, response status and processing time.
using System.Diagnostics;

private static readonly ActivitySource AgentTracing =
 new("CloudPro.A2A");

using var activity = AgentTracing.StartActivity("a2a.send_message");

activity?.SetTag("a2a.task.id", taskId);
activity?.SetTag("a2a.source_agent", "service-desk-agent");
activity?.SetTag("a2a.target_agent", "device-support-agent");
activity?.SetTag("business.operation", "employee-device-support");

try
{
 var result = await SendToAgentAsync(request);
 activity?.SetTag("a2a.result", "completed");
 return result;
}
catch (Exception ex)
{
 activity?.SetStatus(ActivityStatusCode.Error, ex.Message);
 activity?.SetTag("a2a.result", "failed");
 throw;
}
This example does not record the employee’s full message. That is deliberate. Tracing should help diagnose the workflow without copying sensitive prompts, customer records or documents into monitoring systems.
Monitor the measures that affect the business
A dashboard full of technical measurements is not useful if leaders cannot tell whether the service is working. Start with a small set of measures connected to business impact.
Completion and failure rates
Track how many tasks complete, fail, time out or require human intervention. A rising failure rate may indicate a software issue, but it can also reveal expired permissions, an unavailable external agent or a change in a connected business system.
End-to-end response time
Measure the total time from the initial request to the final result, not just the speed of each individual agent. This matters because A2A supports long-running and asynchronous tasks that may continue across several stages.
Retries and repeated conversations
Retries can keep a workflow running during a temporary outage, but uncontrolled retries create duplicate work and higher AI charges. Alert when the same task is repeatedly sent to an agent or begins moving in a loop between agents.
Model and infrastructure consumption
Monitor model calls, token consumption, execution time and Container Apps usage by business process. This helps identify workflows that cost more than expected and makes AI spending easier to explain to finance leaders.
Authentication and access failures
Repeated access denials may mean that an agent has the wrong Microsoft Entra ID permissions or is attempting an action outside its approved role. Our guide to securing A2A communication with Microsoft Entra ID covers how to establish trusted identities for agent connections.
A practical troubleshooting sequence
When an A2A workflow fails, avoid jumping immediately into individual application logs. Follow the conversation from the outside in.
- Confirm the business impact. Identify the affected workflow, users, start time and expected result.
- Find the trace. Search Application Insights using the trace, task or business transaction identifier.
- Locate the slow or failed step. Compare the time spent inside each agent with time spent waiting for models, databases or external services.
- Check identity and network access. Confirm that Microsoft Entra ID authentication succeeded and that the destination endpoint was reachable.
- Review task state. Determine whether the task failed, remained active, waited for input or completed without returning its result.
- Inspect retries. Look for repeated calls, duplicate task creation or agents sending work back to each other.
- Reproduce safely. Use a test environment and sanitised data rather than replaying sensitive production conversations.
Microsoft Foundry tracing can capture agent operations such as tool use, retries, latency and model activity, while Application Insights provides the wider view across custom applications and Azure services. Some Foundry monitoring features may still be offered as previews, so production designs should not depend on preview-only capabilities without a fallback.
What this looks like in a real business scenario
Consider a 200-person professional services company using agents to prepare client onboarding packs. One agent validates the request, another checks Microsoft 365 records, and a third creates the required documents.
Employees report that some packs take 20 minutes instead of three. Basic monitoring shows that every service is online, but distributed tracing reveals that the document agent is repeatedly requesting the same missing customer field.
The business can then fix the input validation rather than buying more Azure capacity. The result is faster onboarding, fewer model calls and less time spent by employees manually checking stalled requests.
Put operational guardrails in place before launch
Production-ready monitoring should include automated alerts for failure spikes, unusual response times, authentication problems, retry loops and unexpected cost growth. Logs should have clear retention rules, access controls and redaction policies to support Australian privacy obligations.
You should also define who owns each agent and who responds when it fails. A technically healthy platform can still create operational risk if nobody is responsible for the business process it performs.
If external agents are involved, monitor them as third-party services. The guidance in connecting Microsoft Foundry agents to external A2A endpoints explains the additional security and governance questions to consider.
Make agent monitoring understandable
Good A2A monitoring is not about collecting every possible log. It is about creating one reliable view of availability, behaviour, cost and business results.
CloudProInc combines more than 20 years of enterprise IT experience with hands-on knowledge of Azure, Microsoft Foundry, OpenAI, Claude, Microsoft Defender and Wiz. As a Melbourne-based Microsoft Partner and Wiz Security Integrator, we help organisations build monitoring that both technical teams and business leaders can understand.
If your agents are communicating but you cannot clearly see where tasks, time or money are going, we are happy to review the setup and identify the most important monitoring gaps — no strings attached.